
Cryptokurtosis: Why Fast Crypto Traders Lose 220x More

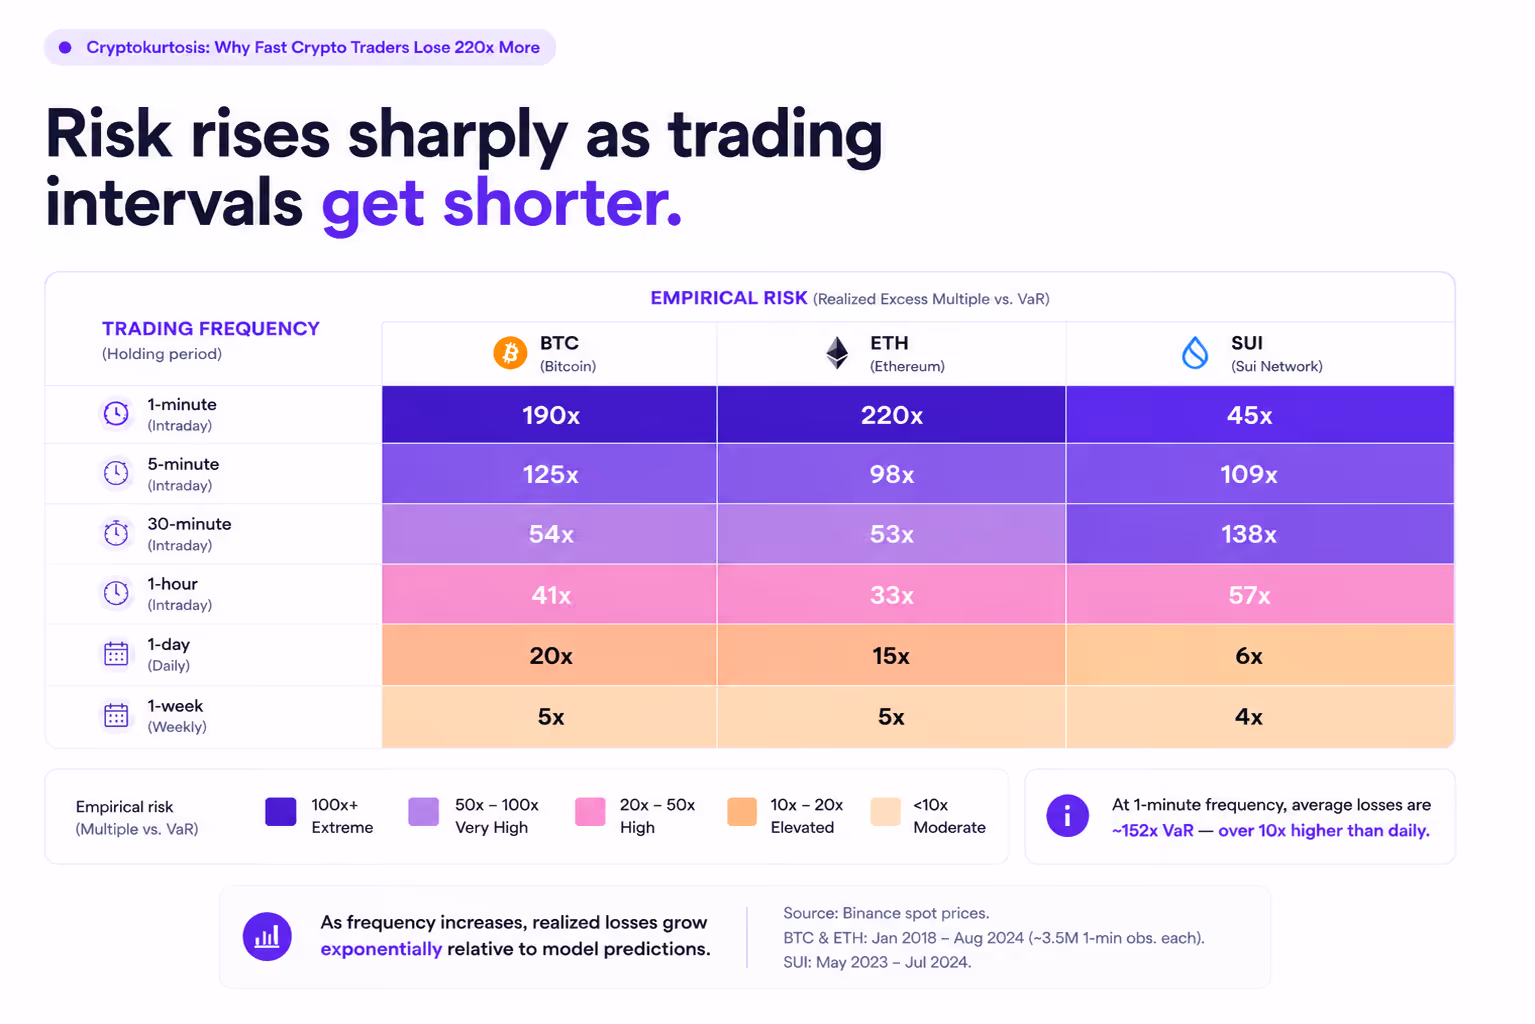
For people who trade crypto at high frequency, the standard Value-at-Risk model significantly understates realized losses. The shortfall is not marginal. Realized excess losses run between 45 and 220 times the VaR prediction, depending on the asset.

That is the finding from work I recently completed with Stavros Degiannakis and George Filis, accepted for publication in Economics Letters. We used 1-minute spot prices from Binance for BTC and ETH from January 2018 through August 2024, and for SUI from May 2023 through July 2024. Roughly 3.5 million observations per asset for BTC and ETH. The question was simple. Across different trading frequencies, how far do realized losses exceed what a 95% VaR model predicts?
A 1-minute BTC trader realizes excess losses approximately 190 times larger than the VaR figure. For ETH, the multiple is 220. For SUI, 45. The daily trader holding the same asset under the same conditions sees the model perform roughly as expected. Same asset, same period, different clock, different distribution.

The mechanism sits in the fourth moment
Kurtosis measures the weight of the tails of a return distribution. A normal distribution has a kurtosis of 3. At 1-minute frequency, BTC kurtosis sits at 120, ETH at 119, SUI at 153. By the daily frequency, those numbers fall to 20, 15, and 6 respectively. Sampled faster, the same return series produces a much heavier-tailed distribution. The relationship is roughly exponential. We call this cryptokurtosis. It is the crypto-market instance of a dynamic earlier identified in foreign exchange markets at high frequency and termed superkurtosis in our 2023 Journal of Money, Credit and Banking paper.
The implication for risk models is direct. Daily VaR was calibrated for daily moments. When applied to a strategy operating on minute or sub-minute bars, it uses inputs that are off by a factor of 40 or more on the parameter that matters most for tail behavior. The realized losses follow predictably from this calibration error.
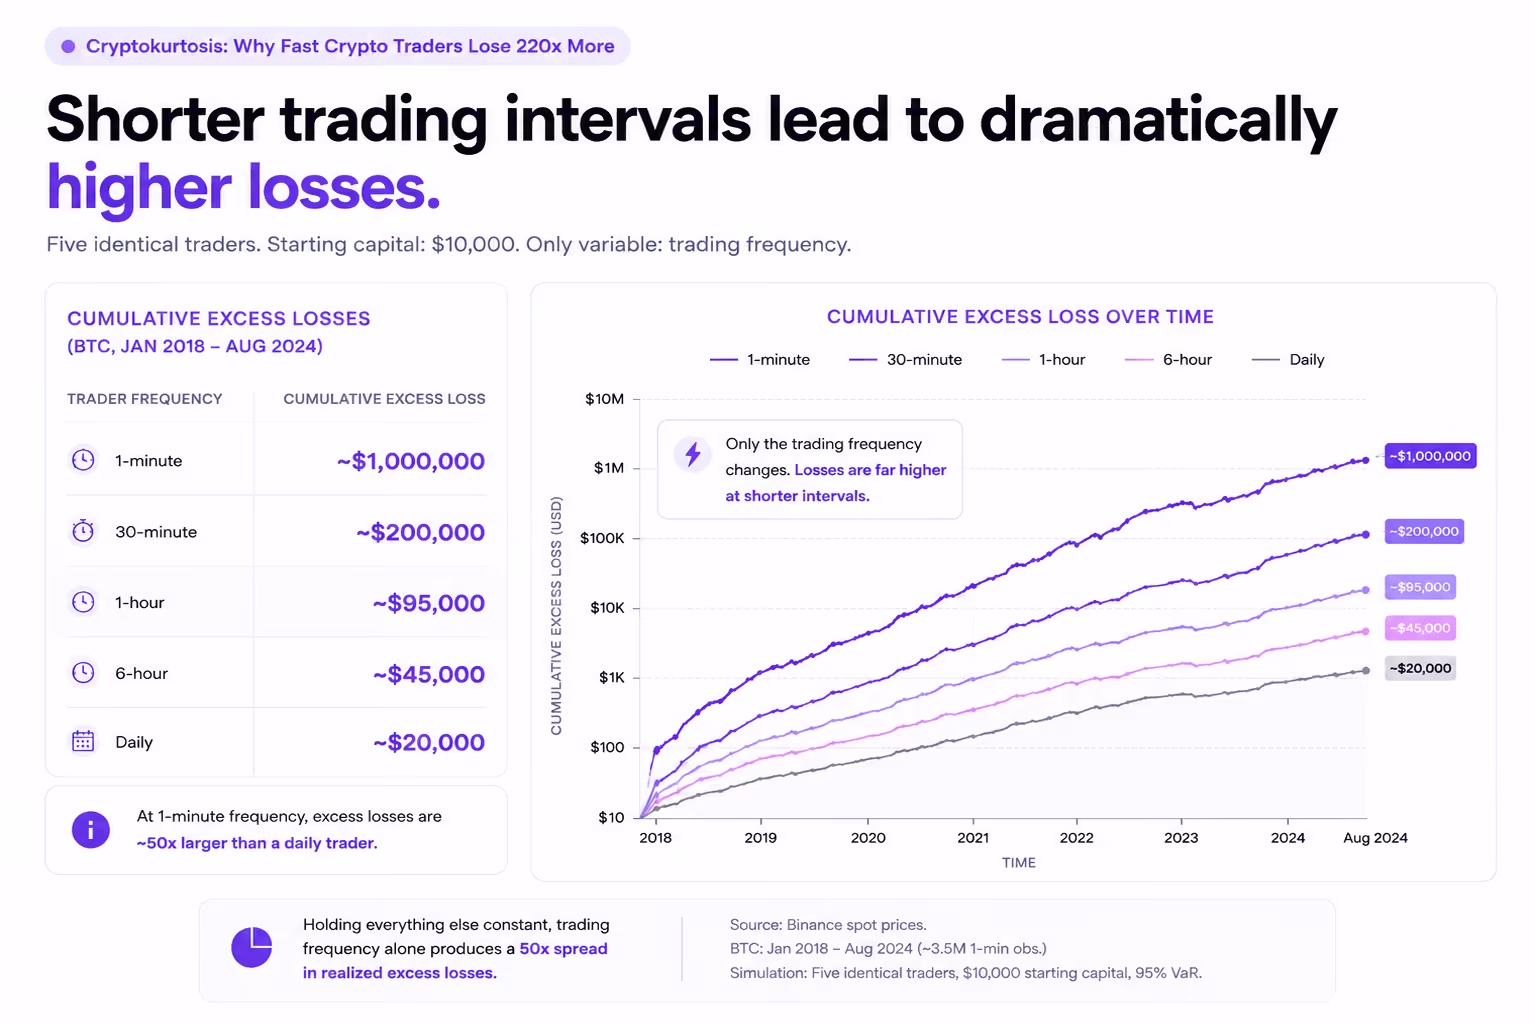
A simulation makes the scale visible. We modeled five identical traders, each starting with $10,000, distinguished only by trading frequency. The 1-minute BTC trader accumulated approximately $1,000,000 in excess losses over the sample window. The daily trader, $20,000. Same asset, same period, same starting capital, same VaR confidence level. The only variable was the clock.
What this means for high-frequency traders and prop desks
For desks running high-frequency crypto strategies, the exposure is immediate and operational. The VaR figure on the screen describes a daily risk, not the risk actually being run. Position sizes calibrated against it tend to be too large, the capital buffer behind them too thin, and stop-losses fire late relative to where realized losses arrive.
Three adjustments follow.
Recalibrate at the trading frequency the strategy actually uses. Most institutional risk systems scale daily moments to other frequencies using rules that assume Gaussian-like tail behavior. That assumption holds reasonably well for daily returns. It does not hold for minute returns in crypto markets. The empirical distribution needs to be measured at the frequency the book operates at.
Size capital against realized excess loss rather than against VaR. VaR is a threshold metric. It identifies the loss point at a given confidence level but says nothing about the magnitude of losses beyond it. For crypto at high frequency, that magnitude is where the relevant risk lives. Expected Shortfall is closer to the right metric, but only if it is computed against frequency-adjusted moments.
Treat trading frequency as a first-order risk parameter rather than an implementation detail. A 1-minute strategy and a 1-hour strategy on the same asset run materially different tail exposures, and the difference is large enough to determine whether a book survives a bad week.
What this means for institutions
For regulated institutions trading these assets, the same mechanic operates with an additional regulatory layer on top.
The internal-model layer is identical to the trader case. Risk models calibrated against daily moments understate the actual exposure of high-frequency books. Margin desks computing collateral against the same inputs are undersizing requirements. Derivatives pricing built on daily implied volatility surfaces is systematically optimistic about tail behavior. The corrective steps are the same. Measure at the right frequency, size against realized excess loss, and treat frequency as a risk parameter in its own right.
The regulatory layer is where the institutional case diverges. The Basel framework classifies cryptoasset exposure by asset type. Group 2b assets, which include BTC, ETH, and most public-chain tokens, carry a 1,250% risk weight. For every $100 of exposure, a regulated institution must hold $1,250 in capital. The number sounds conservative, and for a daily-traded book on a Group 2b asset, it is. For a minute-traded book on the same asset, the empirical excess loss can exceed the capital floor over moderate sample windows.
The structural gap is consistent across jurisdictions. Neither MiCA, the GENIUS Act, nor the FCA consultation closes it. Every major regulatory framework currently in force or in formation classifies risk along the dimension of asset type. None classify along the dimension of trading behavior. Within a single asset classification, frequency is doing more to move the risk dial than the classification itself.
Two institutional responses follow.
Internal frameworks should move first. Capital and position limits set against frequency-adjusted moments produce a more defensible book, more accurate derivatives pricing, and less exposure when supervisors eventually adjust the perimeter. The methodology is available, the empirical inputs exist, and the work is incremental rather than foundational.
The supervisory conversation should begin in parallel. The current framework presumes a uniformity in trading behavior that the data does not support. As institutional crypto exposure continues to grow, the gap becomes a systemic concern rather than a desk-level one.
The structural observation
Risk in these markets is a function of two variables. Asset type is the first. Trading frequency is the second. Frameworks calibrated on the first alone are running on a partial view of the distribution.
The cryptocurrency market is moving from the periphery of institutional finance toward its core. The frameworks that govern it should be calibrated to the frequencies at which the market actually operates. A daily-clock framework will keep producing daily-clock confidence in books that have long since stopped running on a daily clock.
Latest Articles


.webp)


.avif)


.avif)


.avif)
Join 20,000+ businesses already growing
We build and integrate solutions. You grow with xMoney.
