
The 1% Problem

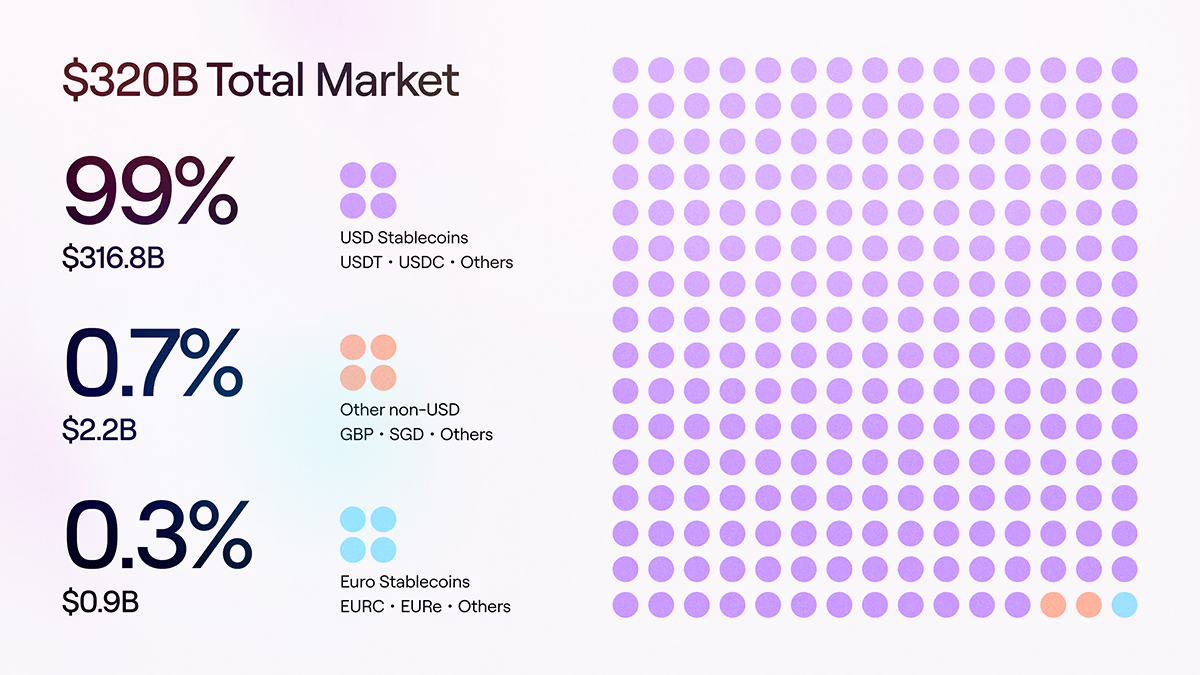
Euro-denominated stablecoins represent approximately 0.3% of total global stablecoin market capitalization. $900 million out of $320 billion. The eurozone is the second-largest currency bloc on earth, yet its digital monetary footprint is near zero.

Let's call it the 1% problem
The numbers deserve to sit for a moment before the analysis begins, because they are more striking than most commentary on European digital finance acknowledges. The ECB's Financial Stability Review confirms them directly: dollar-denominated stablecoins account for roughly 99% of circulating supply. The two largest issuers, Tether and Circle, now hold Treasury bill portfolios comparable in scale to the top 20 money market funds globally. The dollar structured the stablecoin market around itself.
Understanding why requires looking at two distinct forces that compounded together. One is visible and well-discussed, while the other receives almost no attention.
The visible force is infrastructure. Dollar stablecoins did not achieve 99% market dominance through regulatory arbitrage or superior monetary policy. They won because liquidity infrastructure was built around them first. Exchange pairs denominated in USDT and USDC. DeFi protocols with dollar-native liquidity pools. Merchant settlement corridors priced in dollars. Cross-border payment rails that default to dollar denomination across corridors from Southeast Asia to Latin America.
Each layer of infrastructure made the next layer more natural to build in dollars. Each additional dollar-denominated integration raised the switching cost for the one that followed. Infrastructure creates dependency. Dependency compounds. And compounding network effects in payment infrastructure tend not to reverse through regulatory mandate alone.
The less-discussed force is issuer economics, and it matters as much as the infrastructure argument.
When Tether and Circle scale their reserves, they park the majority in short-dated US Treasury bills. US rules list Treasury bills as the preferred reserve asset. At current scale, USDT and USDC together owned approximately 2.25% of the entire US Treasury bill market as of mid-2025, equivalent to $130 billion in holdings. The yield on those assets flows directly to the issuer. Circle reported $1.7 billion in reserve income in 2024 alone. The model is structurally profitable at scale: more stablecoin supply means more Treasury holdings means more yield. The US government benefits from reliable demand for its short-term debt. The issuer benefits from the carry. This loop has no equivalent in the euro stablecoin market.
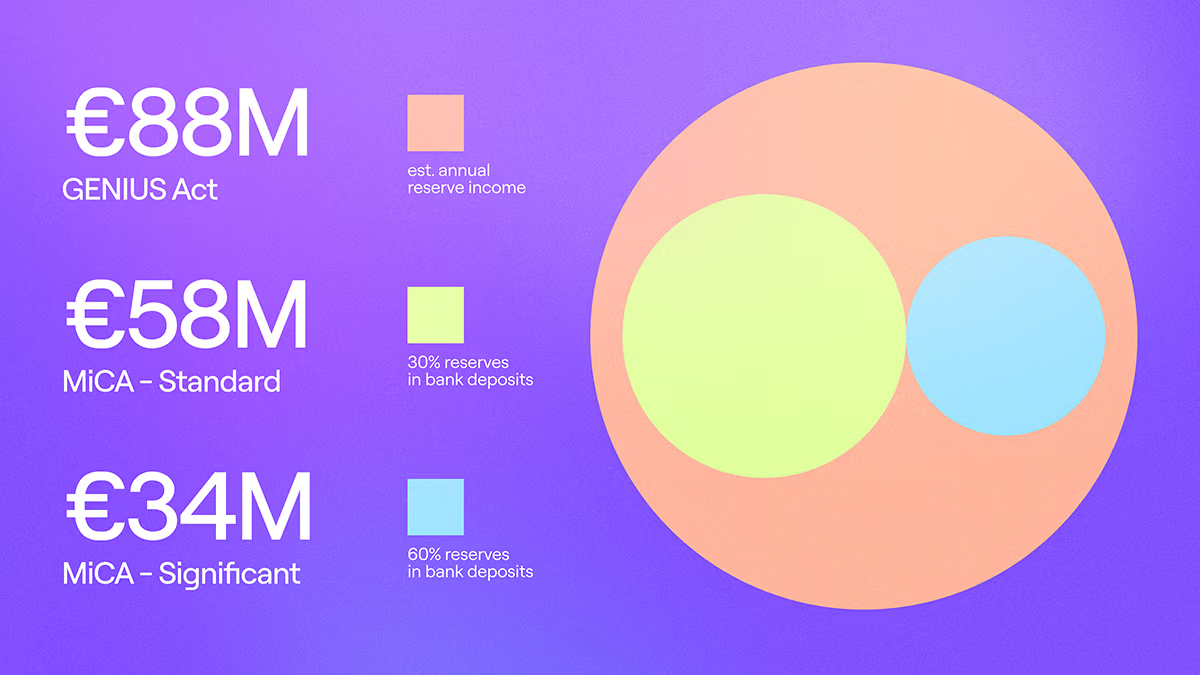
MiCA requires euro stablecoin issuers to hold a minimum of 30% of reserves as bank deposits, a figure that doubles to 60% for issuers that cross the threshold of significance. Bank deposits yield less than government bonds. The revenue compression relative to a Treasury-backed model is material. One analysis comparing a MiCA-structured reserve against a GENIUS Act-equivalent structure on a €5 billion issuance found the difference runs to tens of millions in annual revenue. At the same time, MiCA prohibits euro stablecoin issuers from passing any yield to holders, eliminating an incentive that has driven adoption of dollar-denominated instruments in DeFi and institutional treasury contexts. The regulation is designed to protect monetary sovereignty and financial stability. Those are legitimate policy objectives. The consequence, however, is that euro stablecoin issuance is a structurally less profitable business than dollar stablecoin issuance, which reduces the commercial incentive to build aggressively toward scale.
This is the combination that explains the 1% problem. Infrastructure network effects created dollar dependency in global payment corridors. Issuer economics created a weaker commercial rationale for closing that gap from the euro side. The two forces have operated simultaneously for the better part of a decade.
What makes this worth examining carefully is what the gap is not about. Nine major European banks, including ING, UniCredit, and SEB, have formed a consortium to issue a MiCA-compliant euro stablecoin targeting H2 2026. S&P projects that under upper-bound scenarios, euro stablecoin supply could reach 1.1 trillion euros by 2030. The regulatory architecture is in place, and the institutional mobilization is underway.
The question the market has not answered is whether institutional intent, under current economics, translates into the payment infrastructure depth that drives actual adoption. Every euro-denominated commercial transaction that settles through a dollar stablecoin transfers a small increment of monetary gravity out of Europe. Individually, the transfer is negligible. Cumulatively, across the settlement flows of an increasingly stablecoin-native global commerce layer, the pattern matters. It shapes treasury allocation, cross-border pricing conventions, corridor economics, and ultimately structural demand for euro-denominated assets. These are monetary policy outcomes expressed through technology adoption, which makes them harder to see in real time and harder to reverse once they are established.
S&P's 1.1 trillion euro projection is achievable. But projections describe possibility, not probability.
The next five years will produce a clearer answer than the last ten. The institutional mobilization is real, the regulatory foundation is set, and for the first time, the infrastructure investments required to close the gap are being made by operators who understand both the compliance layer and the payment mechanics.
The 1% problem is a solvable one. Whether it resolves in five years or fifteen depends almost entirely on whether the rails being built today are designed for euro primacy or euro compatibility. Those are not the same outcome.
Latest Articles


.webp)


Join 20,000+ businesses already growing
We build and integrate solutions. You grow with xMoney.
